
Data analytics and visualization are moving at a break-neck speed in the technological world. Newer players, whether big or small, are dipping their foot in BI tools and software. Tableau and Power BI are amongst the big players in the data analytics and visualization tools.
To stay ahead in this data analytics race, one should use a tool that must have a mix of power, simplicity, reliability, use, price, and fault-tolerant. Both Power BI and Tableau tools have this perfect balance, which is why many teams find themselves comparing these two tools when looking for the ideal data analytics tool.
Tableau and Power BI’s difference is that Tableau is a BI and data analytics tool for generating reports and data visuality with high flexibility. In contrast, Power BI is also a Data visualization tool to analyze business and derive insights.
In this difference between Tableau and Microsoft Power BI blog, I will give you an idea of how these two Business Intelligence tools differ from one another.
Tableau vs. Microsoft Power BI: Which is more popular?
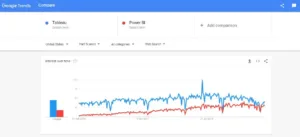
From the above Google Trends screenshot, one can evaluate that Tableau is ahead of Power BI in terms of customer preferences. But Microsoft Power BI is closing in recent times.
Tableau vs. Power BI: Difference Across Parameters
Tableau is a Data analyzing and visualization tool that specializes in creating special reports. It can convert raw data into an understandable and clear format without any programming and tech skills.
Tableau is one of the fastest-growing and aggressive data visualization tools used in the BI and DBMS industry. Data analysis is quick in Tableau, and the visualizations are formulated directly in the dashboards and worksheets. This feature helps technologists and analysts understand the data model made using Tableau at any stage of the business.
Tableau can handle a large volume of raw data with better performance. It also has excellent customer support with a massive community forum and portals for open discussions and doubts resolving sessions.
Features of Tableau
Here are essential features of Tableau:
- Data blending
- Technical or coding skills not required
- Real-time analytics
- Data collaboration and data notifications
- DAX analysis function
- Toggle view and drag-and-drop in dashboard
- List of native data connectors
- Filter and sort data
- Share and Embed dashboards
- Mobile-friendly dashboards
- Tableau-reader for data viewing
- Create “no-code” data queries
- Translate queries to visualizations
Power BI is also a Data visualization tool provided by Microsoft. Its main goal is to provide business intelligence with interactive visualization. Power BI uses Microsoft’s services like Azure, SQL, and Excel to build data visualizations at a cheaper rate.
It is a decent software for those looking for a cost-friendly option for MSBs and startups that need data analytics but don’t have a set capital dedicated towards software.
Power BI is a business intelligence tool that helps you to control raw data from different origins and provides visualization after processing the data. It also offers an ad-hoc feature that assists in scanning the data.
Features of Microsoft Power BI
Here are essential features of Power BI:
- Customizable dashboards with navigation pane
- Q&A question box
- Help & feedback buttons
- Ad-Hoc reporting and analysis
- Online Analytical Processing (OLAP)
- Trend indicators with reports insights
- Complete reporting & data visualization tools
- Real-time dashboards that help analysts to solve problems as they take place
- Power BI offers a self-embedded azure service. It allows other MS applications to interact with Power BI
- The Q&A feature of Power BI enables users to ask doubts using natural language to solve queries
- Content Packs for sharing and collaborating dashboards among the team
There are many points of comparison Tableau vs. Microsoft Power BI performance-wise, such as:
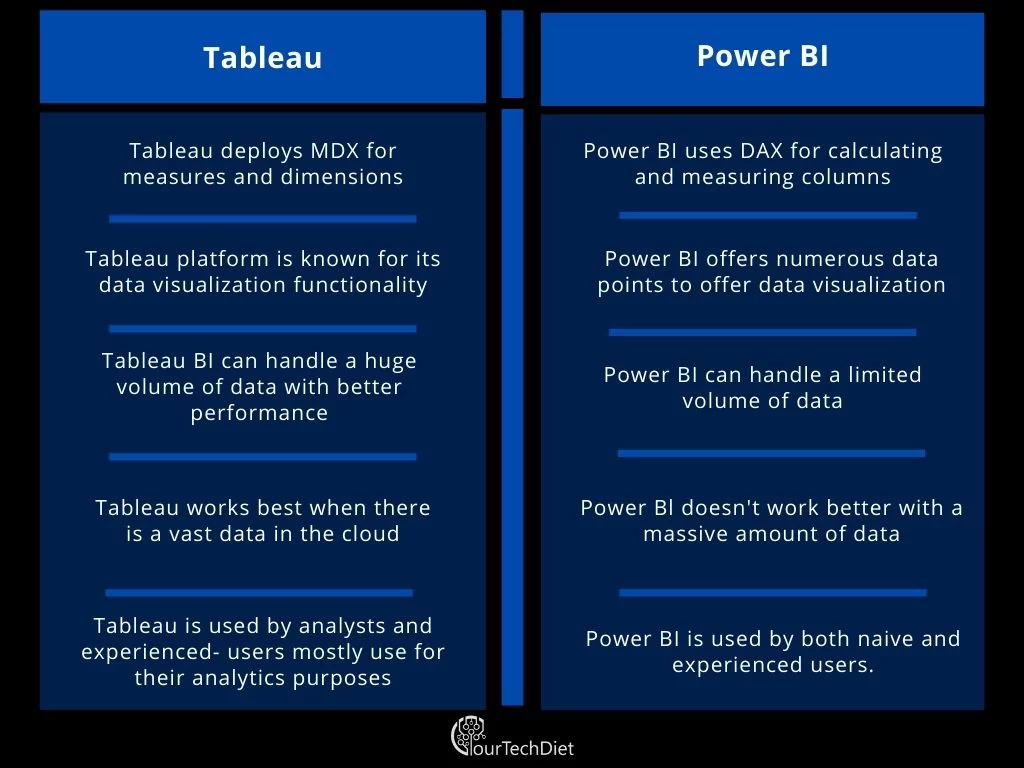
- Power BI can handle a limited amount of data. In comparison, Tableau can handle a massive volume of data efficiently.
- Power BI has over 3000 data points for mapping, whereas Tableau has only 24 different data points.
- Power BI is limited when it comes to customer support. In comparison, Tableau not only has excellent customer support but colossal community forums and portals.
- Power BI is well suited for freshers and new users, while experienced professionals use Tableau.
- Power BI is suited for all sizes of businesses, from startups to MNCs. At the same time, Tableau is well-suited for Medium to Large scale businesses.
- Power BI connects to limited data sources, while Tableau can connect with many data sources simultaneously.
Here are some of the similarities between Tableau and Power BI:
- Both Tableau and Microsoft Power BI are designated as Business Intelligence tools.
- Both are used for Data Analytics and Data Visualization.
- Both have a desktop and online version of the software, Tableau Desktop, and Power BI desktop.
- Tableau and Power BI, both have a machine-accessible SaaS prototype. But, Tableau additionally has a Cloud deployment option.
- Both allow customers/users to various data sources to the respective software.
Below is the list of Tableau Products with its brief description.
Tableau Desktop:
Tableau desktop offers large feature sets with robust reporting. For those who can code, they can personalize the reports. Whether it is pie-chart, bar graphs, line graphs, etc., one can choose the style of reports. Also, you can blend charts with information in the dashboard.
Tableau Desktop Professional:
Tableau Desktop Professional has full access to all the data points and all sorts of data types. It is considered one of the premium versions of all Tableau products. Tasks completed on Professional can be put online and on Tableau Server.
Tableau Desktop Personal:
Tableau Desktop Personal is limited as compared to Professional, but most of the features are similar. It keeps the workbook private and incapable to be published online on Server. For this reason, tasks should be published offline or in Tableau Public.
Tableau Server:
Tableau server is used to share the dashboard’s work and visualization reports created in the Tableau Desktop applications across the firm. To publish work/tasks in Tableau Server, one must first publish it on Tableau Desktop. Only licensed users can then download the reports from the Tableau server.
Below is the list of Power BI Products with its brief description.
Power BI Desktop:
It is the primary tool for sanctioning and publishing reports. Developers can code and create reports according to their liking and from scratch.
Power BI Server:
It is the main tool as an online SaaS product where Power Bl data-models, reports, and dashboards are maintained. Team collaboration, commenting, analysis, and visualization happen here.
Power BI Data Gateway:
Power BI Data Gateway extends to Power Bl Service and other data points and data sources like Query, Upload, Export, Live Query. It is installed by Bl Admin/Analyst.
Power BI Report Server:
It is the on-premises product for reporting daily, with the flexibility to move to the cloud tomorrow. It is considered a premium service as one can upload the whole work to the cloud. Report Server is also a web portal where one can display and handles reporting and KPIs.
Conclusion
Individual or Business requirement plays a significant factor in Tableau vs. Microsoft Power BI comparison, in terms of selection. Power BI is built for newbies and clients with low-budget, whereas Tableau is robust, making it challenging to learn, not to mention the high price of Tableau.
It all comes down to visualization, interface, and intuitive features. Both have their pros and cons and finally draws a tie between these two major tools. A business analyst is the one to decide which software will suit the team and the firm. The above specifications are beneficial for any customer or analyst to decide which tool to choose.
Also Read:
Tableau vs. Splunk: How the Two Data Visualization Software Differ?
Domo vs. Power BI: Which is the Right BI Solution?